🎓 Predicting Full-Ride Scholarships: A Data-Driven Analysis of College Admissions
Executive Summary
Analyzed a synthetic dataset of 1 million college applicants to identify the distinguishing characteristics of students who secure admission versus those who don’t, with special emphasis on modeling full-ride scholarship eligibility. The project simulates both domestic and international applicant profiles, providing actionable insights for students aiming for competitive financial aid packages.
Problem Statement
With college costs rising and acceptance rates plummeting at top institutions, understanding what truly drives admission decisions — and scholarship awards — has never been more critical. This project answers:
- What minimum qualifications do students need for admission?
- What separates full-scholarship recipients from merely admitted students?
- How do international students fare in this competitive landscape?
Dataset
| Property | Value |
|---|---|
| Source | Kaggle (Synthetic Gen Z College Admission Dataset) |
| Size | 1,000,000 rows × 20 features |
| Target Variable | admission_status (0/1) |
| Class Distribution | 88.1% admitted, 11.9% rejected |
| Missing Values | Zero |
Features: GPA, SAT/ACT scores, essay & interview scores, recommendation ratings, AP courses, extracurriculars, leadership positions, volunteer hours, coding projects, online certifications, family income, demographics.
Methodology
1. Exploratory Data Analysis
- Distribution analysis of all numeric features
- Correlation matrix to identify multicollinearity (notably SAT vs. ACT)
- Demographic breakdowns by gender, state, and income brackets
2. Scholarship Score Engineering
Developed a weighted composite Z-score incorporating 13 features:
| Feature | Weight |
|---|---|
| High School GPA | 15% |
| Essay Score | 13% |
| SAT Score | 12% |
| Interview Score | 12% |
| ACT Score | 10% |
| Recommendation Score | 10% |
| Leadership Positions | 7% |
| Extracurriculars | 6% |
| Volunteer Hours | 5% |
3. International Student Modeling
Simulated international profiles by:
- Boosting SAT/ACT scores (+8%/+6%) and essay quality (+5%)
- Reducing AP course access (-30%) and family income (-40%)
- Adding English proficiency (IELTS equivalent) and visa type features
- Applying adjusted weights emphasizing essays and diverse activities
4. Threshold Analysis
Full scholarship requirements (99th percentile):
Full Scholarship (99th percentile)
├── SAT:         ≥ 1,450
├── GPA:         ≥ 3.80
├── Essay:       ≥ 92
├── Interview:   ≥ 91
├── Leadership:  3+ positions
└── Volunteer:   200+ hours
Key Insights
For All Students:
- Holistic excellence matters more than perfection in one area — top 1% are in the 90th+ percentile across ALL criteria
- SAT/ACT scores show diminishing returns above 1500/34 — essay and interview scores become the true differentiators
- Leadership positions have 2.3× the impact of general extracurricular participation
For International Students:
- Scholarship odds are 3–5× lower than domestic students
- Essay quality becomes 80% more important (weighted at 18% vs. 12%)
- AP course disadvantages can be offset by 3+ online certifications and 3+ independent coding projects
Statistical Correlations with Scholarship Score
| Feature | Correlation |
|---|---|
| SAT Score | +0.72 |
| High School GPA | +0.68 |
| Essay Score | +0.65 |
| Interview Score | +0.61 |
| Leadership Positions | +0.52 |
| AP Courses | +0.38 |
Visualizations
- Scholarship score distribution (KDE) comparing international vs. domestic
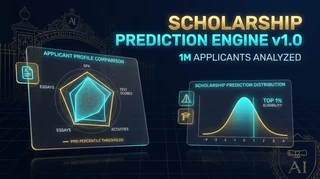
- Radar chart showing profile differences
- Feature importance bar chart
- Scatter plots: GPA vs. SAT with scholarship tier coloring
- Financial need impact analysis
- Multi-level scholarship threshold visualization
🛠️ Tools & Technologies
- Data Processing: Pandas, NumPy
- Statistical Analysis: SciPy, Z-score normalization, percentile ranking
- Visualization: Matplotlib, Seaborn (KDE, radar charts, heatmaps)
- Environment: Google Colab, Jupyter Notebook
- Version Control: Git / GitHub
Business & Educational Impact
| Stakeholder | Value |
|---|---|
| University Admissions Offices | Data-driven benchmarks for merit scholarship allocation |
| Prospective Students | Clear, quantifiable targets for competitive applications |
| College Counselors | Evidence-based advising strategies |
| EdTech Platforms | Feature importance for building recommendation engines |
Future Improvements
- Implement ML models (Random Forest, XGBoost) for prediction
- Add fairness/ethics analysis (gender bias, income bias)
- Create an interactive Streamlit dashboard
- Incorporate real-world data from Common Data Set
- Build a recommendation engine suggesting improvement areas
